Prioritize issues to increase productivity

Increase productivity by monitoring which issues happen most often and which take the longest to resolve.
When an issue arises, you may be tasked with finding exactly what went wrong and what needs to be fixed first, a difficult job to do by hand. Guidewheel helps you find this information much more easily. By using the Auto-resolve feature for Alerts, you can now see exactly which machines have the most issues and which issues are taking the longest time to resolve. Knowing these metrics will help you and your team prioritize problems that would result in the biggest productivity boost if resolved quickly.
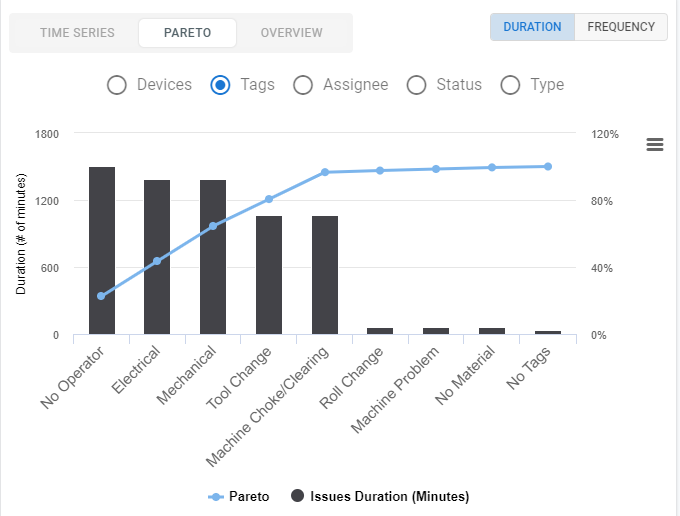
Our last post highlighted the usefulness of Auto-resolve and Do Not Disturb for pinpointing and recording where issues lie and how long they take to resolve. These same features produce data regarding not only the frequency of specific issues but also the duration of these issues over time, allowing you to clearly find which issues cause the largest toll on production. To access the analysis of this data, go to the Issues page and click on the Analysis tab. On the top right corner of the diagrams, you can find buttons to toggle between Duration and Frequency on the display for each type of analysis. On the top of the Pareto and Time Series diagrams, you can also select different filters to further focus your analysis.
For example, if you needed to find out which machine had the most issues throughout a certain time period, first specify the “From” and “To” dates, then make sure that “Devices” is selected. This information can help you figure out where extra resources and time should be spent to improve productivity.
To see issues even more clearly in the context of more data, the Uptime, Production, and Diagnostics pages each have an eye icon at the right of each item that can highlight the durations and types of issues over a graph showing the machine’s activity during the specified time period. For the Uptime and Production pages, click on an item to expand before clicking on the eye icon at the top right of each diagram to view the issues. This visual representation of the issues can help you quickly find exactly what time the problems arose, how long they have lasted, what the problem actually is, and which machine needs attention.
If an issue was not caught by an Alert with Auto-resolve, you can easily create and tag a new issue on the Uptime, Production, and Diagnostics pages. Hover over the Load Curve on any of the diagrams until you find the start point of the issue. Make sure your cursor is directly over the line (there will be a dot with a circle showing you where to press). Double click on the dot to mark the starting point of the Issue and enter Issue-creation mode. Then click on the dot again, hold, and drag your cursor until the highlighted area encompasses the entire Issue duration. If you decide to create another Issue at a different point on the Load Curve, just move your cursor to the new point and drag. This will create a new issue without the hassle of inputting specific times. Make sure to tag each of the manually inputted issues as well so you can have a complete analysis of your data later.
If you find more creative ways to perform analysis on Guidewheel, please do not hesitate to contact us at info@safi.ai. We love hearing how Guidewheel is helping teams improve productivity.

