Find exactly what you need, at a glance

Personalize your platform to show the components that you need and minimize information that is less relevant.
Some machines and metrics likely matter more to you than others. If you only operate a specific set of machines, you probably use the metrics for those machines the most frequently. Instead of scrolling through irrelevant information just to find what you need, Guidewheel allows you to customize the metrics and machines that you see on your platform so you can quickly find what matters most to you at a glance.
Prioritizing certain machines:
Guidewheel allows you to view the metrics for all the machines on the platform at once, but you may only need to see updates or analyses for a few. To eliminate distractions from information you don’t need, try placing relevant machines in a Group.
To create a Group, go to Settings > Configurations > Devices Groups. Click on the plus (+) button (on the far right of the blue band) to create a new Group. A Group’s name, machines, and other settings are fully customizable to fit specific needs. For example, each operator or department can create their own Group, or a set of related machines on the same product can also be combined in a Group for quick viewing. You can also choose to disable or enable a Group by clicking on the slider on the right of each Group name. Disabled Groups will not be visible on other pages.
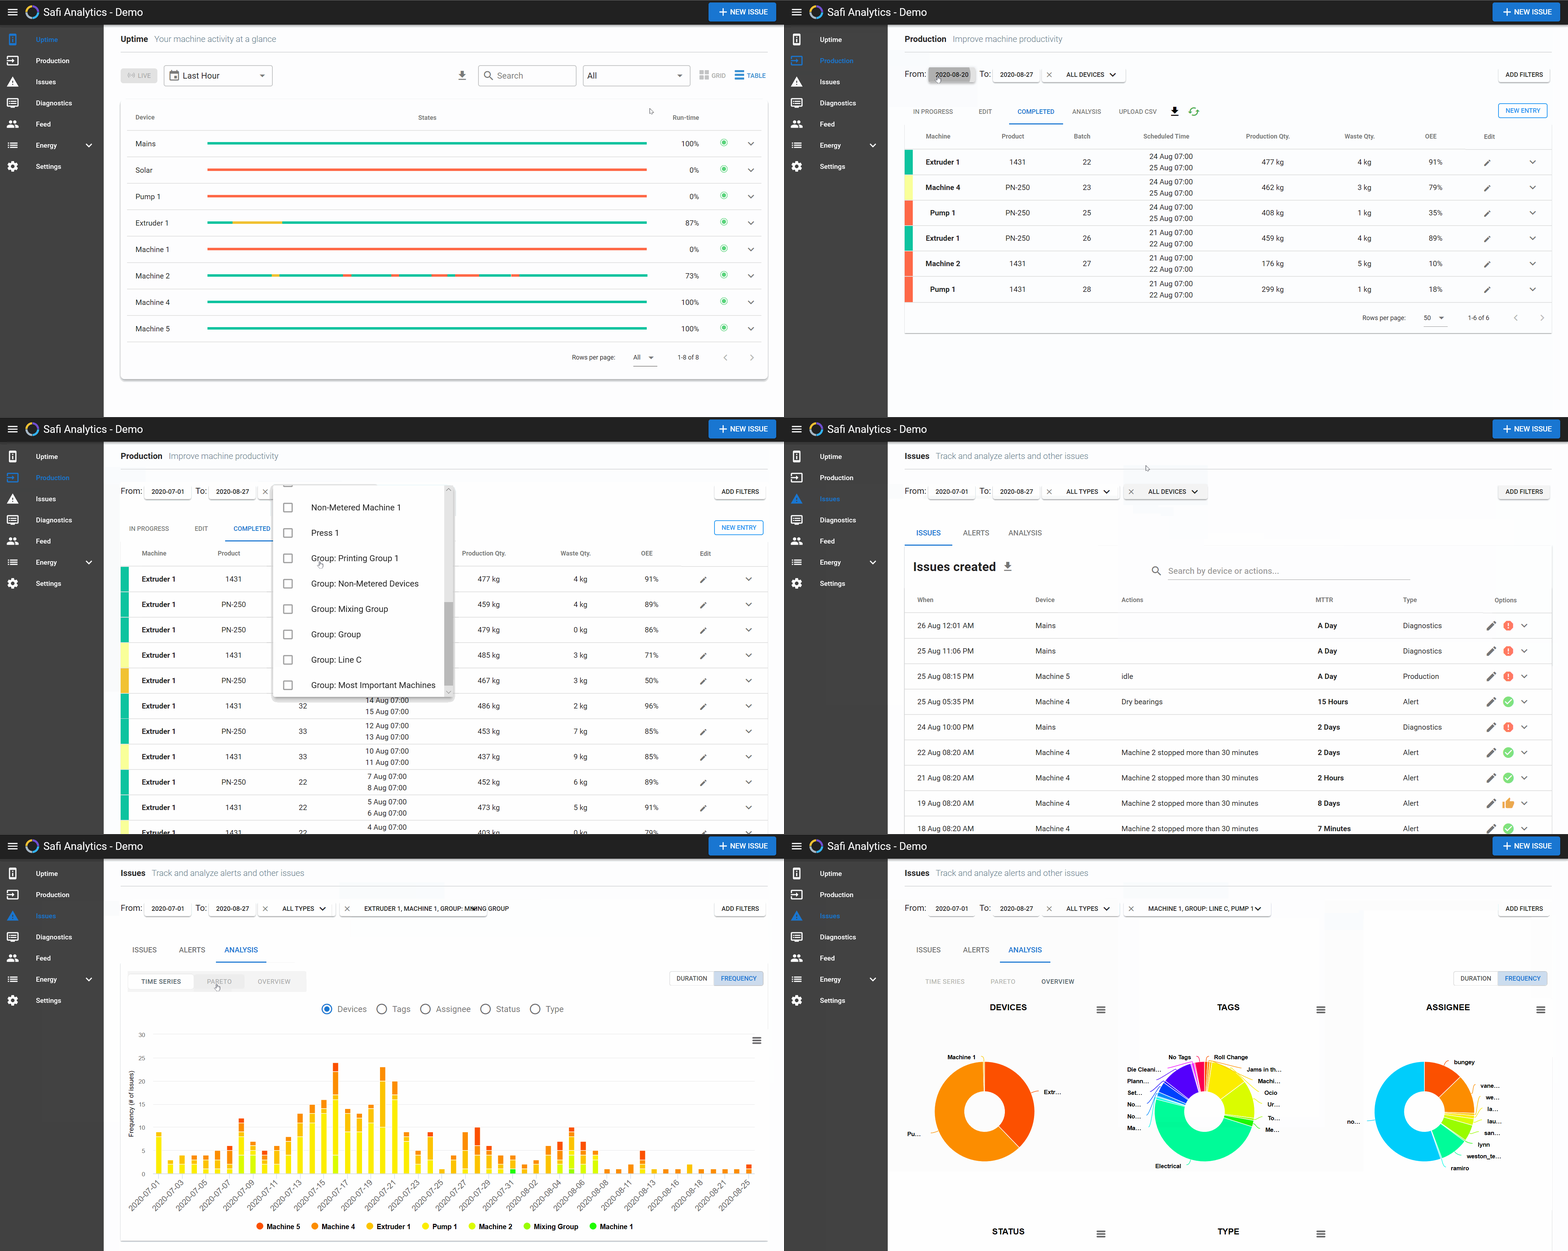
On the Uptime page, filters can be adjusted so the page only displays metrics for the machines of a certain Group. Click on the dropdown box that says All and select the Group name you made earlier. As a reminder, next to this dropdown menu you can toggle between the Grid and Table formats depending on preference.
On the Production page, you will find a dropdown box that says All Devices next to the date filters (From-To). Click on it to see a list of the machines followed by the Groups you made earlier. Scroll through the list and select the machines or Groups you would like to view by clicking on the checkbox at the left of each item. If you check the box for a Group, the Group as well as all of the individual machines in it will be displayed.
On the Issues page, if you do not see the dropdown box with All Devices, you can click on Add Filters at the top right corner of the page and select Devices. This will display the All Devices dropdown box at the top of the page. You can try filtering by Groups on each tab of each page, like the Analysis tab of the Issues page. To analyze only a certain Group of machines, follow the same steps: Add Filters > Devices > All Devices > choose your Groups or machines.
Using this feature on the Production and Issues pages can help you focus on just the metrics and machines you care about, making it easier to detect when one of your machines needs attention. Whether you are a supervisor in charge of a set of machines or a manager who frequently checks on specific Groups more than others, keeping a browser tab pre-filtered with a Group can help eliminate time spent scrolling and searching for information.

Prioritizing certain metrics:
You may find yourself scrolling through irrelevant information on long Email Reports just to find the updates you need. Now, Guidewheel’s Email Reports can be personalized to show only the metrics you need in the order you want to see them for easy viewing.
To customize Email Reports, click on the Settings > Preferences > Email Reports. The Email Reports section allows you to change the recipients and frequency of Summary and OEE reports on their respective tabs. Now, you can customize the content and structure of Email Reports in the Summary section (below Email Reports). On the left side of the Summary section, you will see a selection of components normally found in an Email Report. To add or remove an element from your Email Report, select or unselect their respective checkbox.
If you would like to keep receiving the different components of the Email Report but view them in a more convenient order, stay on the Summary section. On the left side, select the components you want to keep as shown above, then on the right side you can drag and drop each component into the preferred sequence.
For instance, if machine Uptime matters the most to you, you can unselect other components of the Email Report so that you are only updated on machine Uptime. Alternatively, if you want to keep other components of the email but see Uptime first, drag Uptime to the top of the list of components.
Changes to Email Report components and the order of components will also be reflected in the overall Summary page, which you can access from Energy > Summary.
Get the updates you need, when you need them:
The new features on Guidewheel help you clean up your account interface and inbox so finding the information that you need is even faster and easier than before. Focusing on the machines most important to you by creating Groups can speed up analysis and make tracking changes more manageable. One last place for you to find quick updates is the Feed page, which includes current summaries of issues and other activities that can also be filtered to give you the information you are looking for.
We are grateful to our customers whose suggestions have helped us improve the usability of the Guidewheel platform, including the development of customizations as detailed in this post. If you have specific questions regarding personalization of your account or comments on how we can improve, please do not hesitate to contact us at info@safi.ai.

